Context. Precise continuum normalisation of merged échelle spectra is a demanding task necessary for various detailed spectroscopic analyses. Automatic methods have limited effectiveness due to the variety of features present in the spectra of stars. This complexity often leads to necessity of manual normalisation which is time demanding task.
Aims. The aim of this work is to develop fully automated normalisation tool that works with order-merged spectra, and offers flexible manual fine-tuning, if necessary.
Methods. The core of proposed method uses the novel deep fully convolutional neural network (SUPP Network) that was trained to predict the pseudo-continuum. The post-processing step uses smoothing splines that gives access to regressed knots useful for optional manual corrections. Active learning technique was applied to deal with possible biases that may arise from training with synthetic spectra, and to extend the applicability of the proposed method to features absent in such spectra.
Results. Developed normalisation method was tested with high-resolution spectra of stars with spectral types from O to G, and gives root mean squared (RMS) error over the set of test stars equal 0.0128 in spectral range from 3900 Å to 7000 Å and 0.0081 from 4200 Å to 7000 Å. Experiments with synthetic spectra give RMS of the order 0.0050.
Conclusions. The proposed method gives results comparable to careful manual normalisation. Additionally, this approach is general and can be used in other fields of astronomy where background modelling or trend removal is a part of data processing. The algorithm is available on-line: https://git.io/JqJhf.
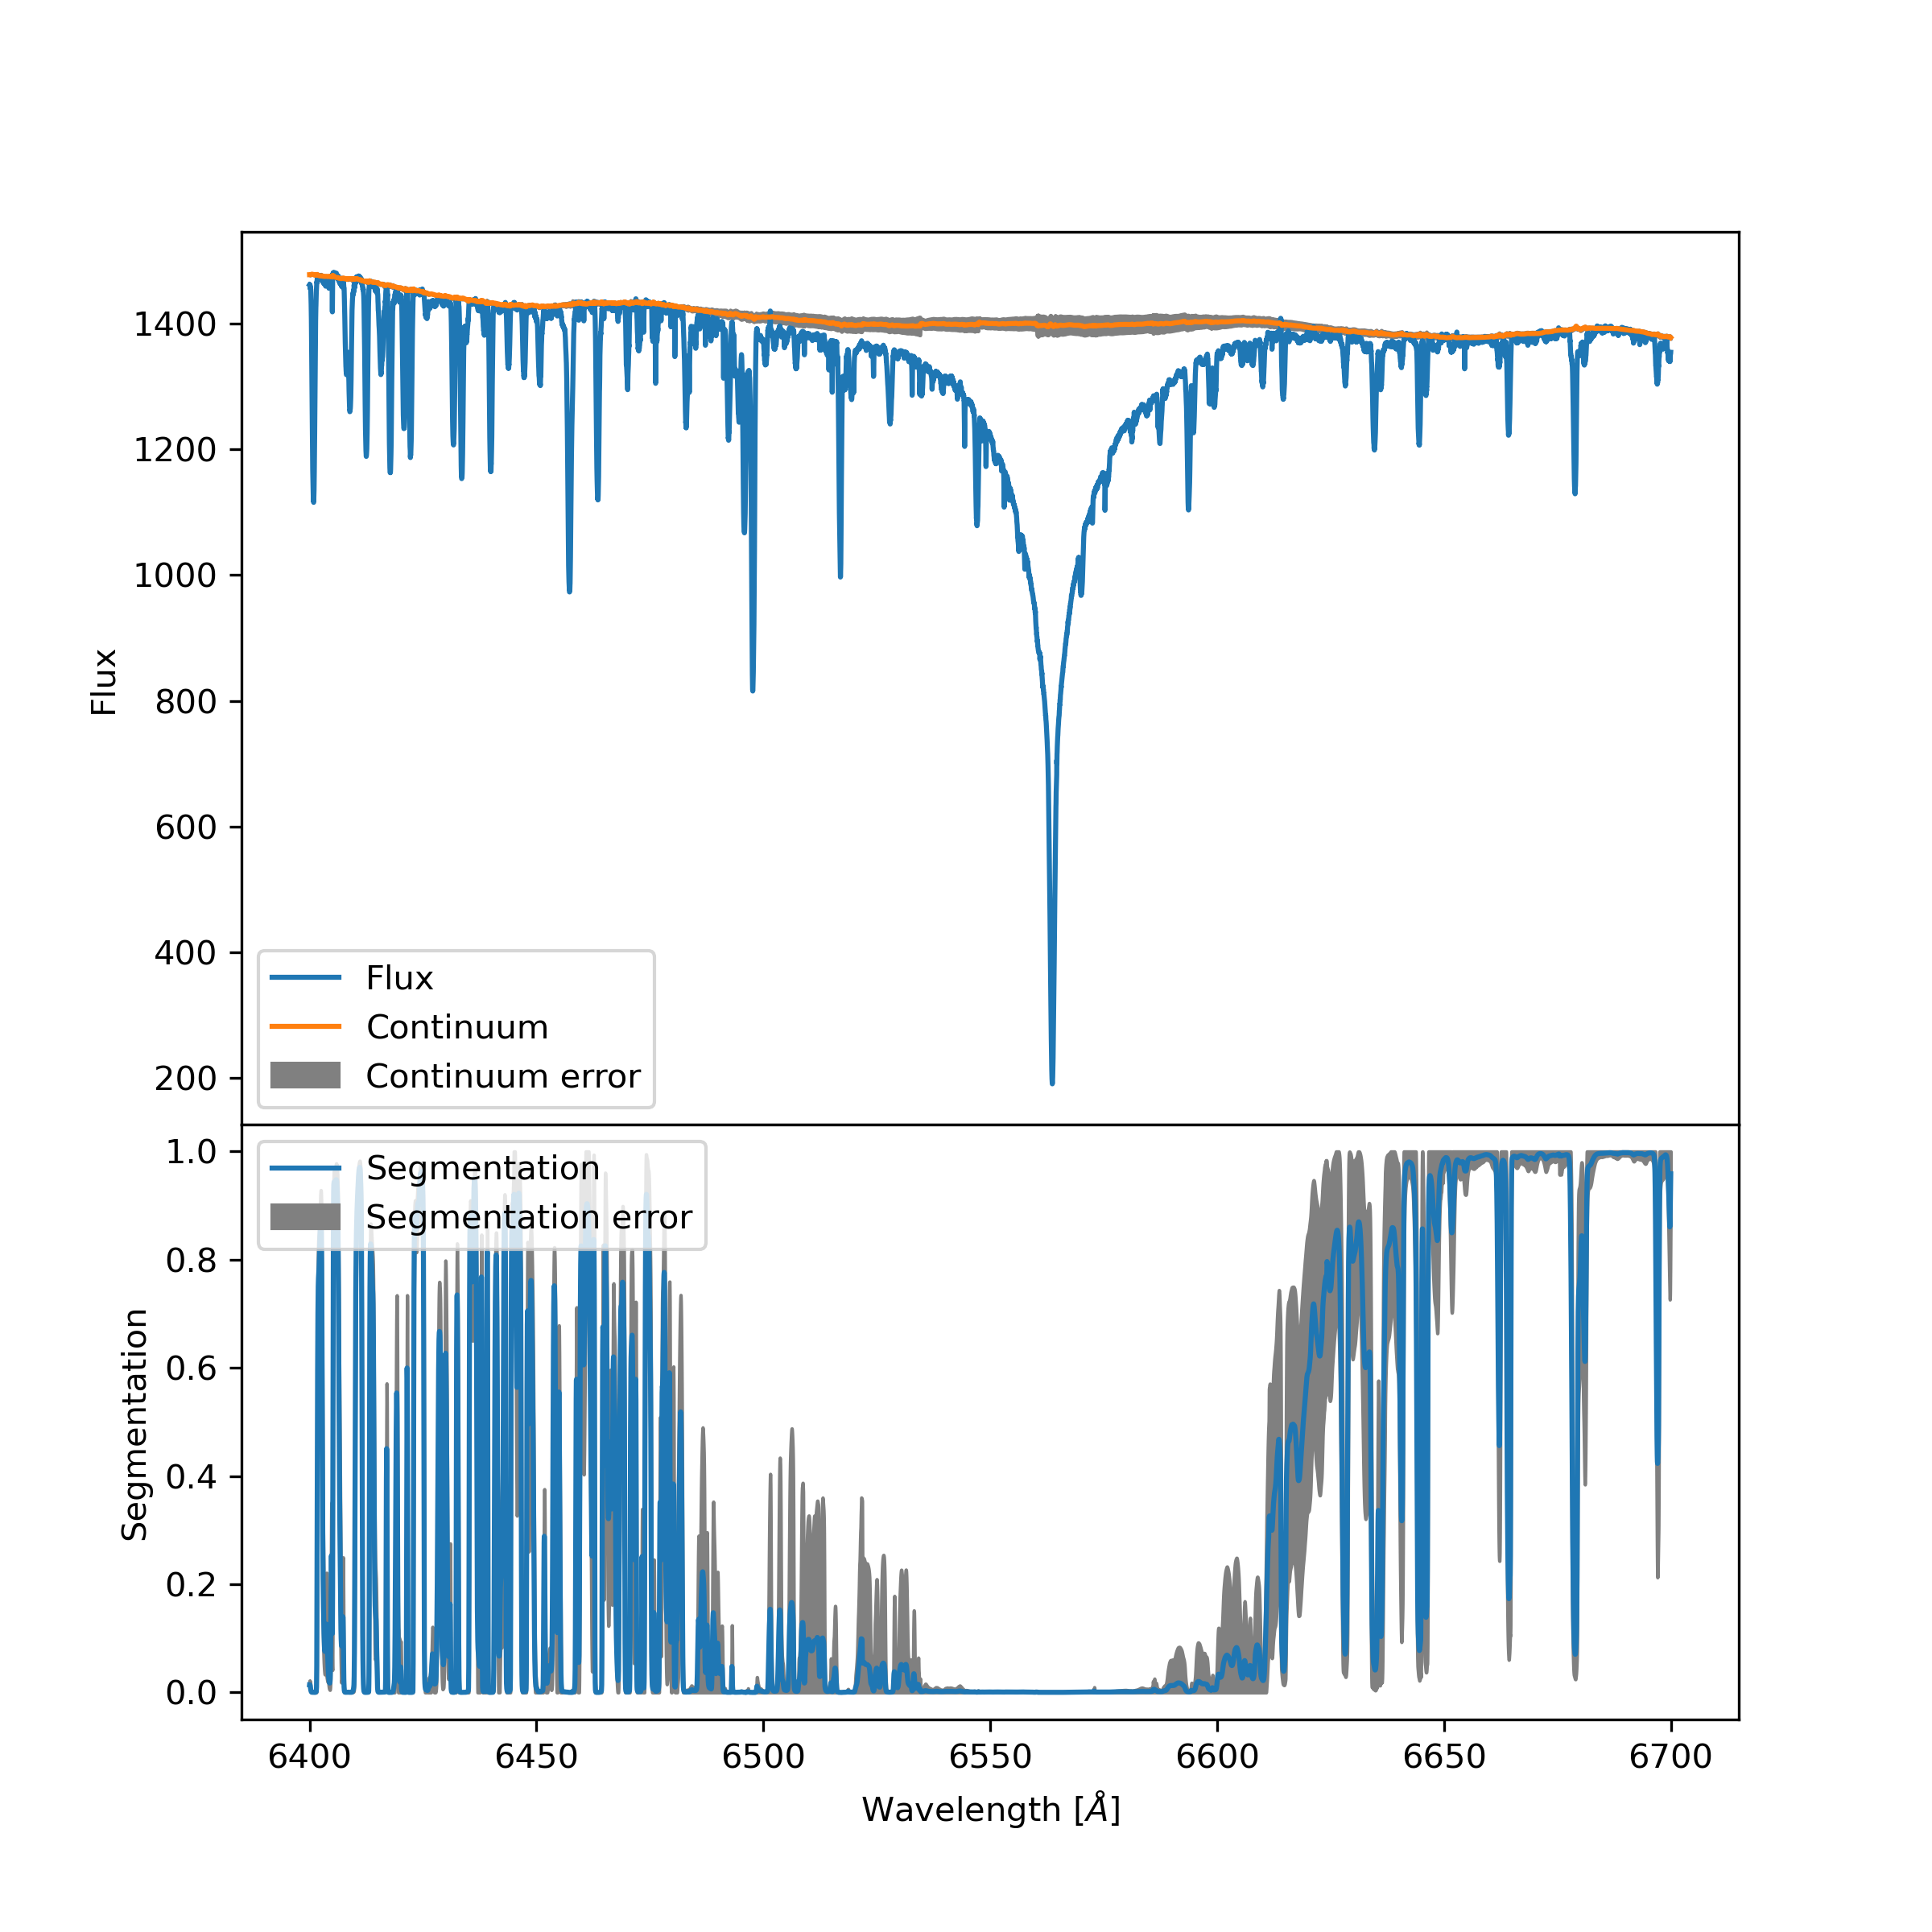
Result of HD27411 (A3m) spectrum processing. Upper panel shows spectrum and predicted continuum near Ha line. Lower panel shows corresponding segmentation mask. Shaded area denotes estimated uncertainty.
Distribution of loss function values of neural networks randomly sampled from tested architectures trained in the task of pseudo-continuum prediction. One hundred random neural networks, with number of trainable parameters ranging from 200000 to 300000, were drawn for each architecture. The training was held in low-data regime, for only 30 epochs.
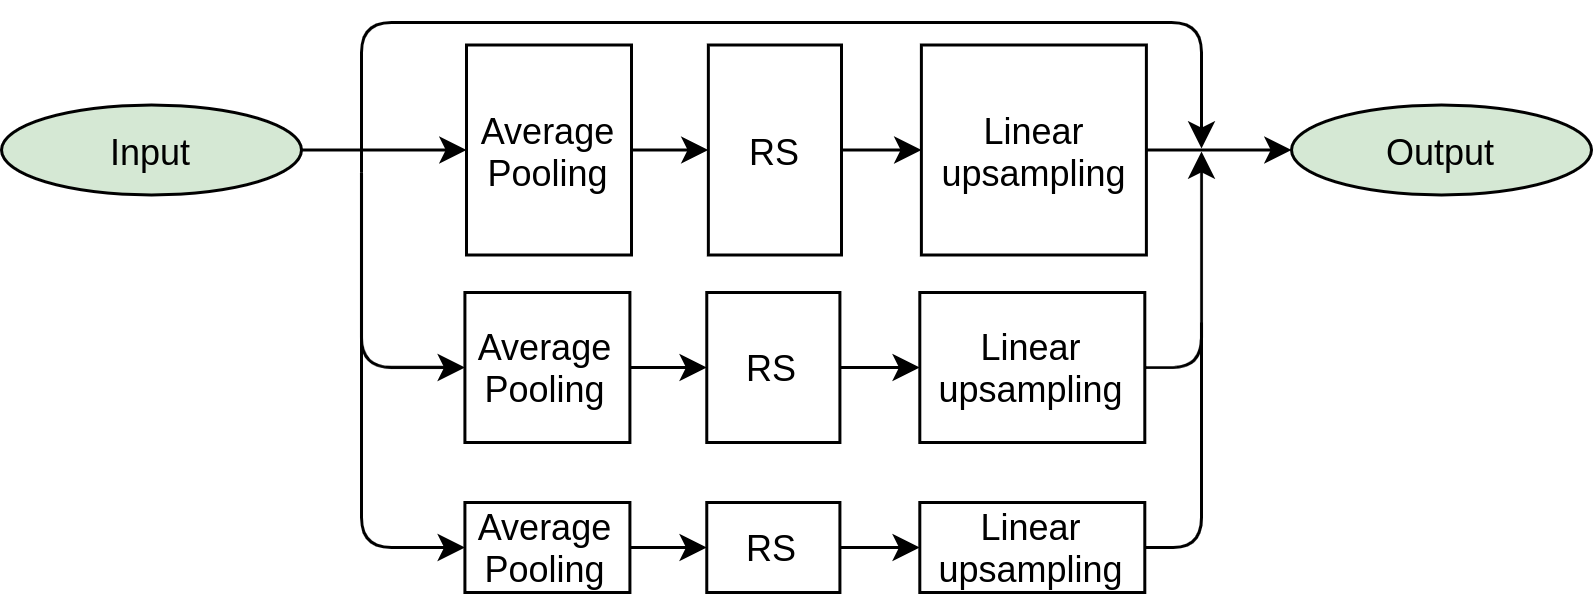
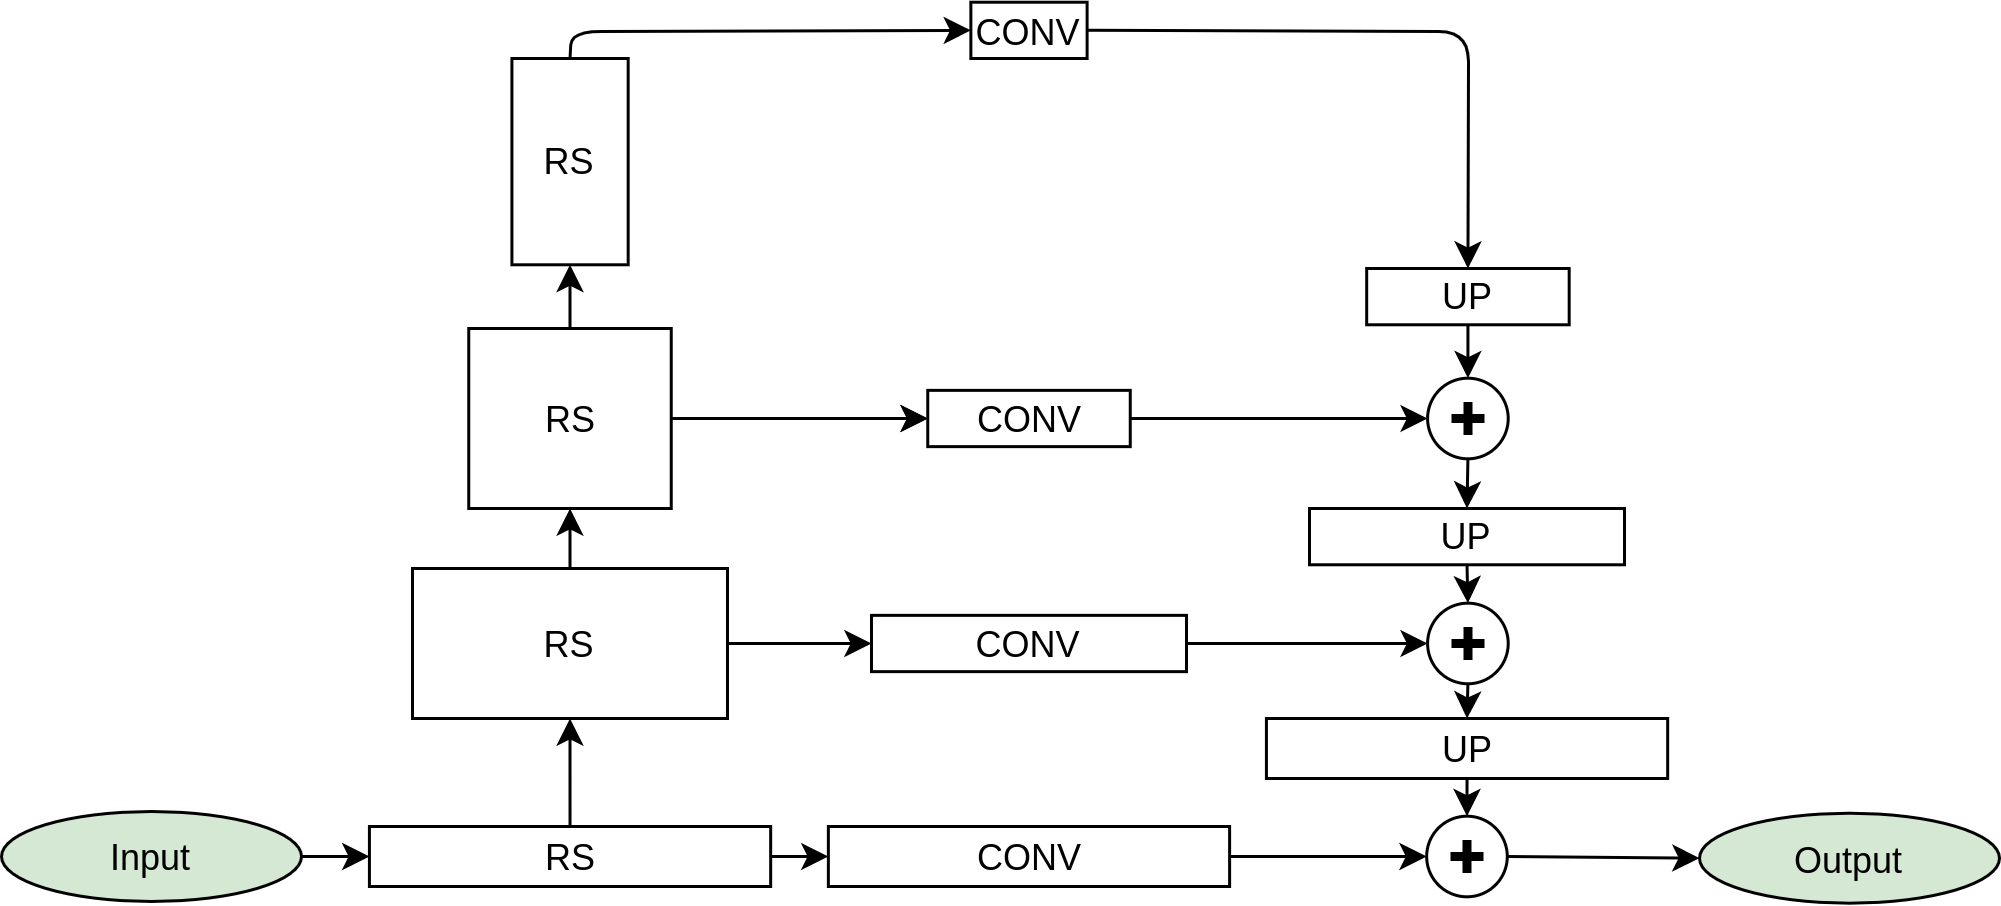
Pyramid Pooling Module (PPM) used in PSPNet and UPPNet networks. PPM pools input feature maps at different scales, process them using residual stages, linearly upsample features to input resolution and finally concatenate them with input features. In this work PPM pools input features to all resolutions that strictly divides input resolution, e.g. for features resolution equal 32 it pools at scales: 2, 4, 8 and 16. Number of residual blocks in each RS and number of features in each residual block was the same for all PPMs used in exploratory tests and equal respectively 4 and 8.
Diagram of U-Net with Pyramid Pooling Modules -- UPPNet. Two residual stages (RS) on the left create the narrowing path. Downward arrows represent strided residual blocks that decrease sequence length by the factor of two. Central part has three PPM modules, the bottom one is preceded by RS. The widening path, on the right, is a reflection of the narrowing path. Upward arrows represent upsampling by the factor of two. The upsampled features are concatenated with the result from the PPM blocks before being fed into the RS blocks. Depth of this UPPNet is defined as two.
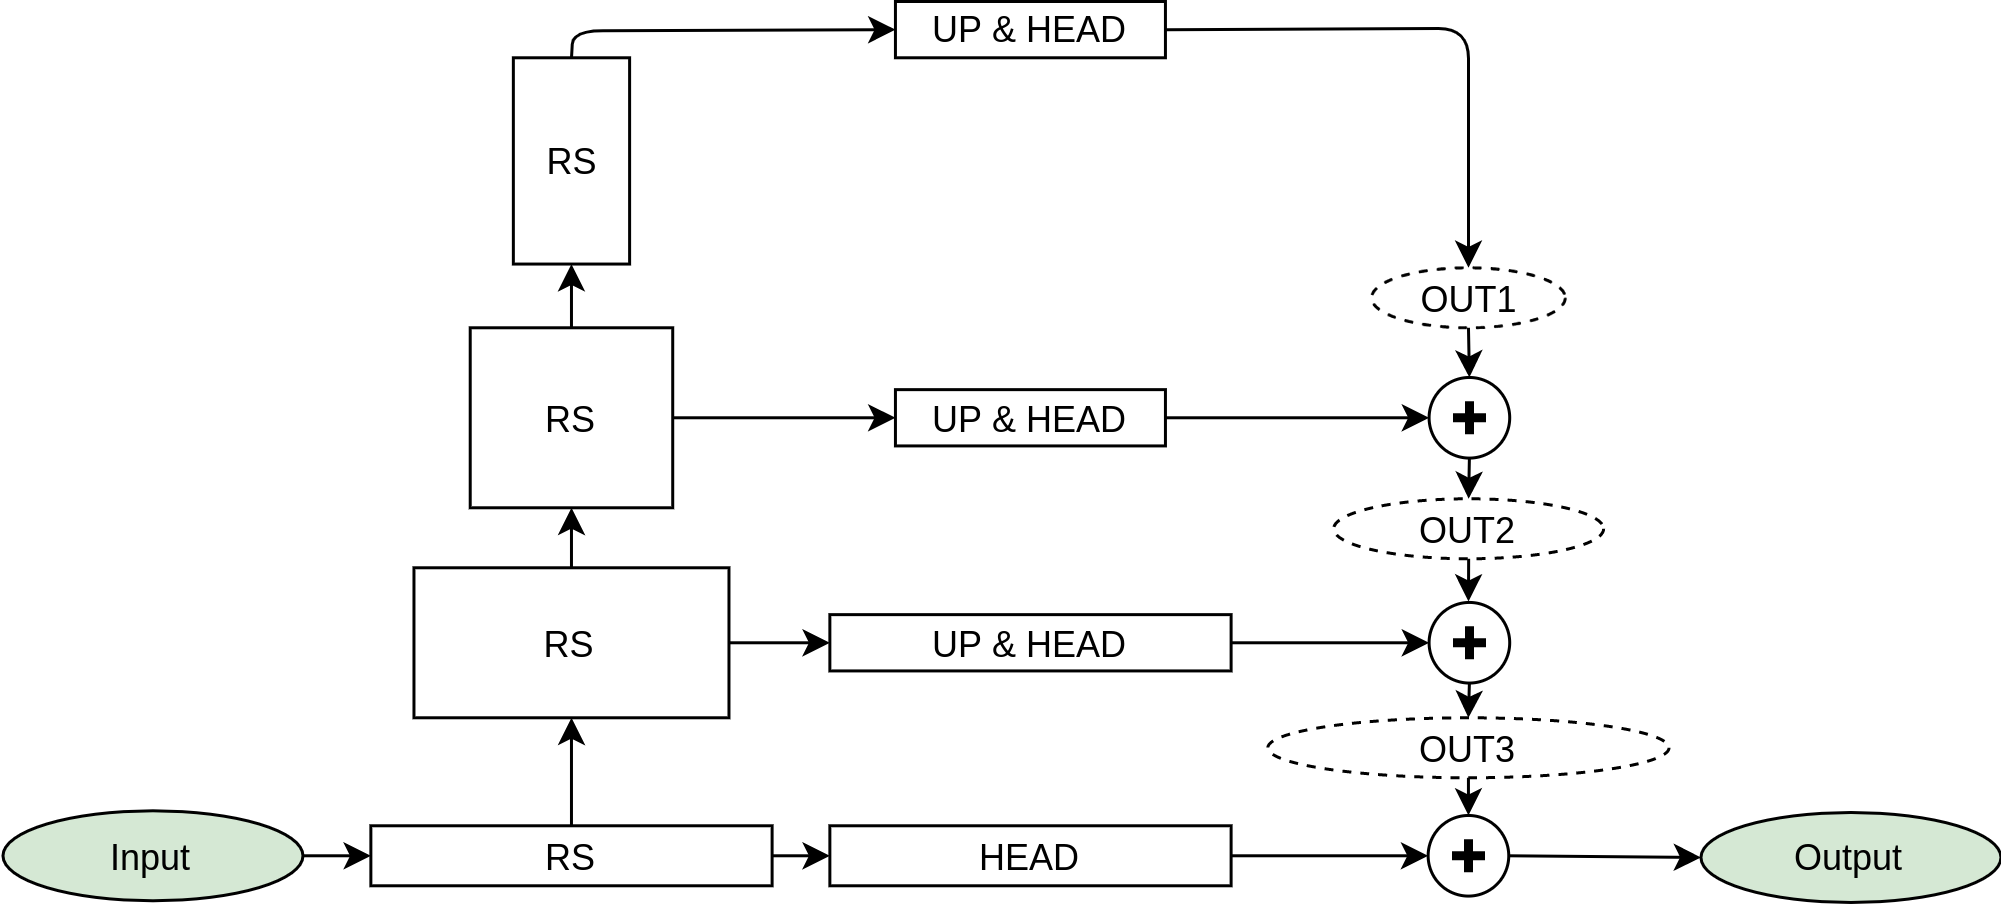
Block diagram of proposed SUPP Network. The network is composed of two UPPNet blocks and four prediction heads. First UPPNet block forms coarse predictions, and high resolution features maps that are forwarded to second block (dashed arrow). Coarse predictions in intermediate outputs Cont 1 and Seg 1 (first convolution and segmentation outputs, respectively) are forwarded to the second block. The second block forms final predictions at Cont 2 and Seg 2 outputs.
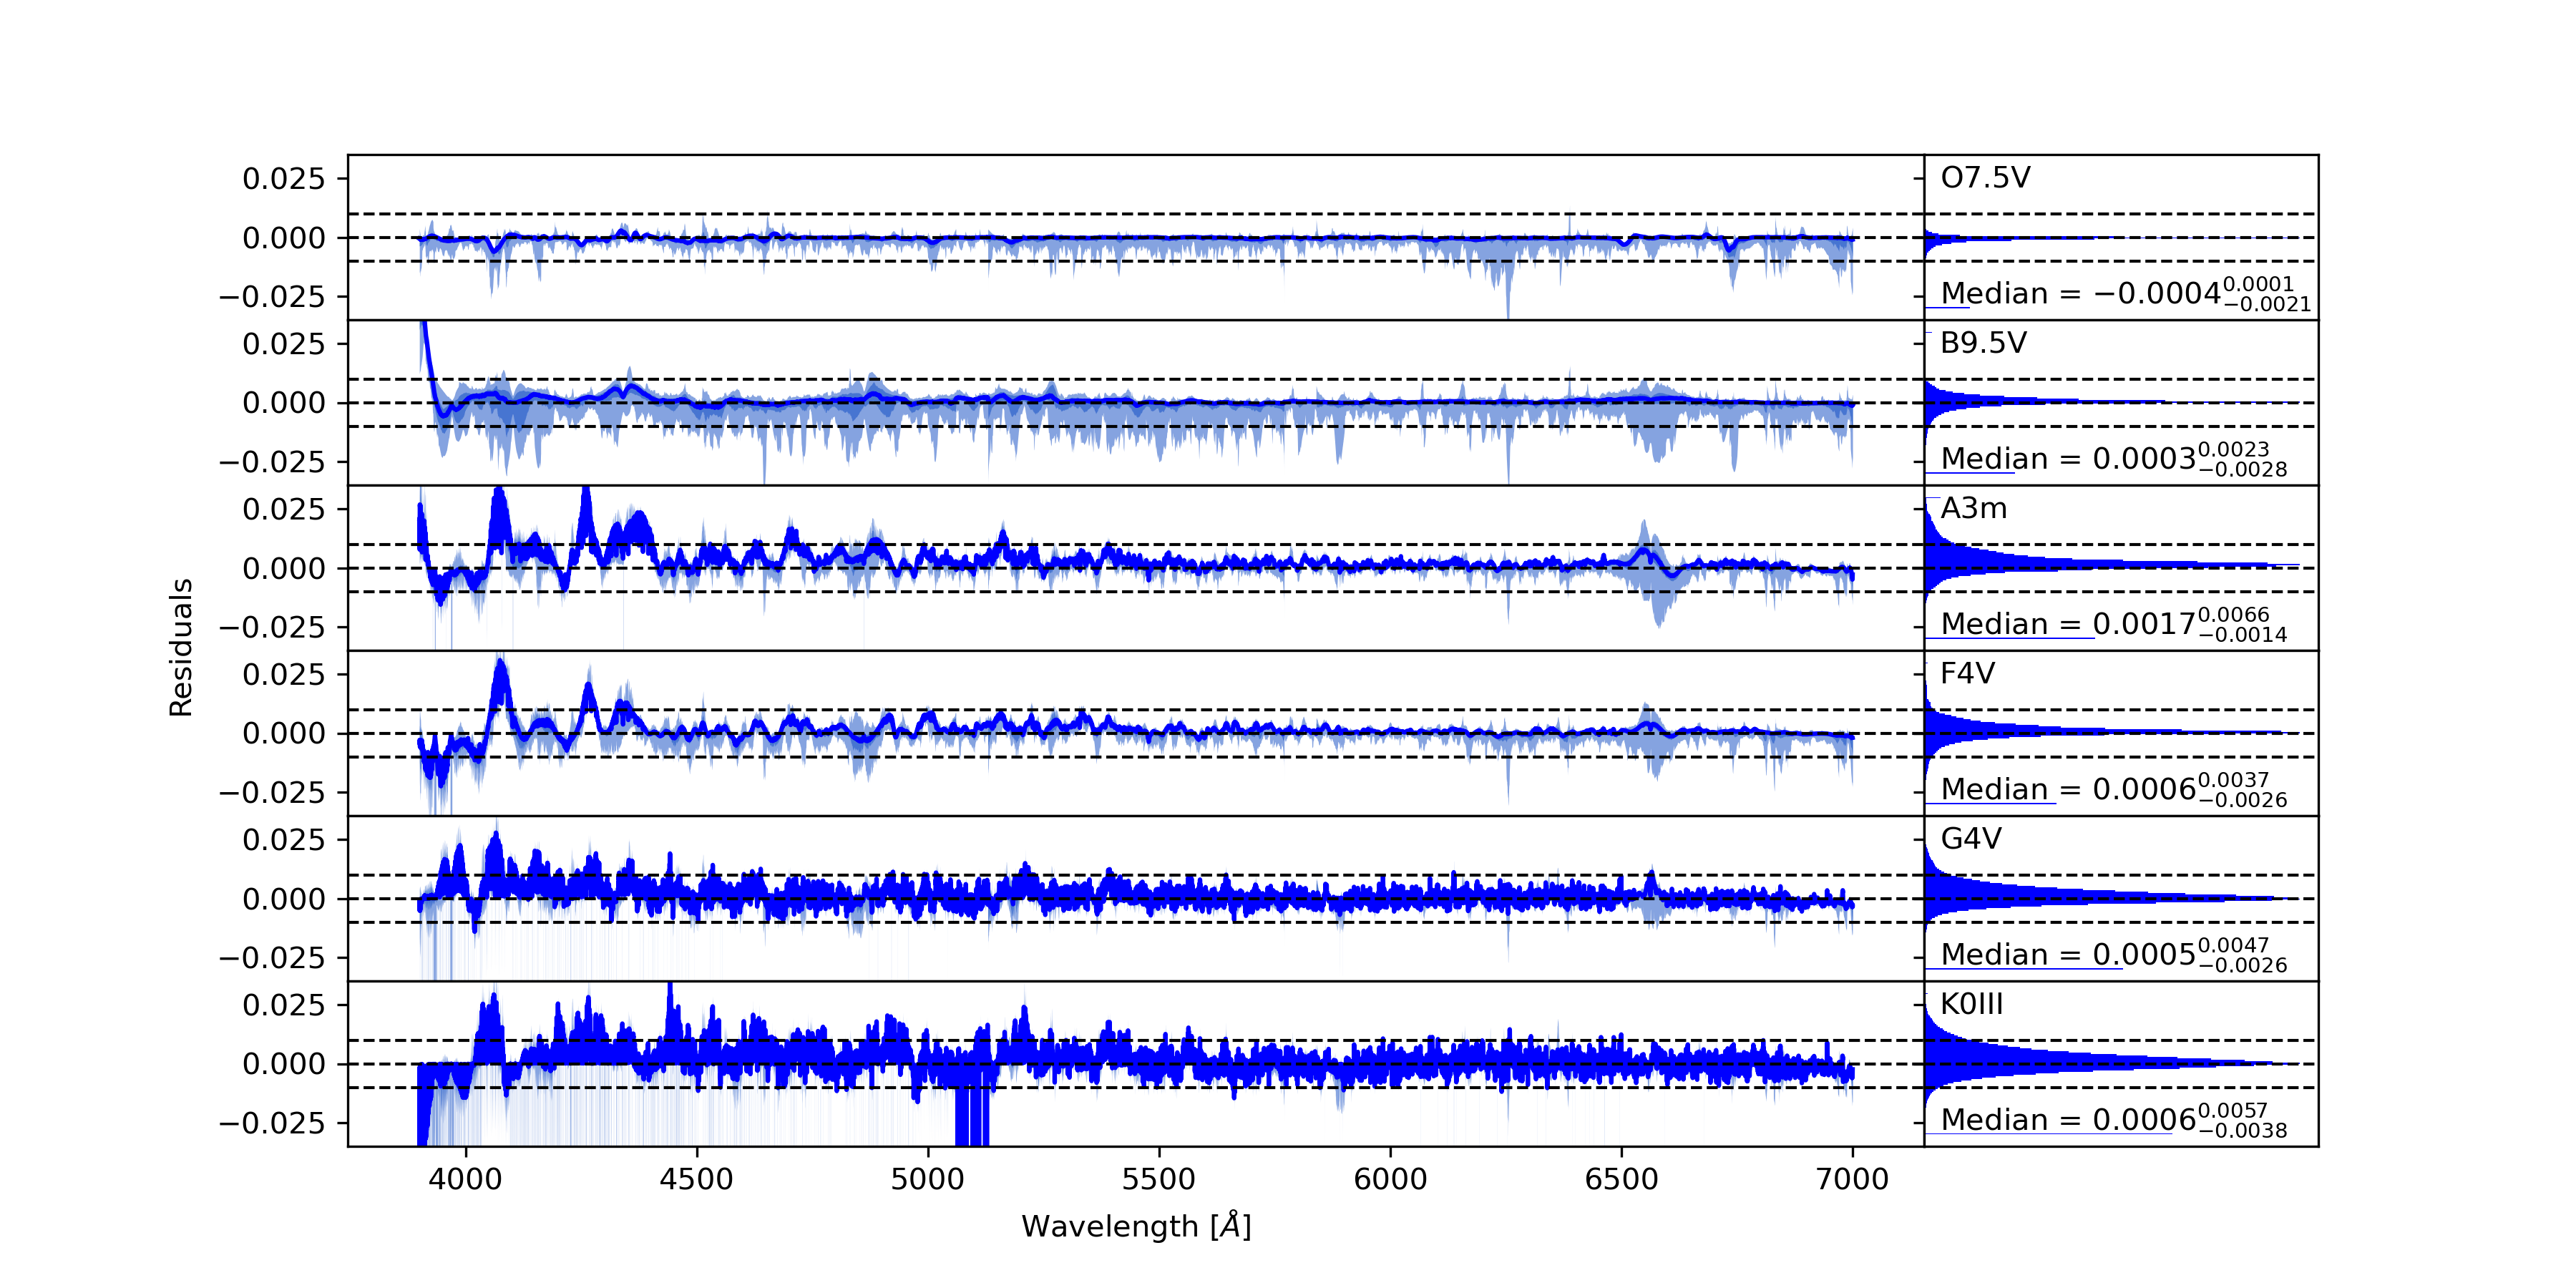
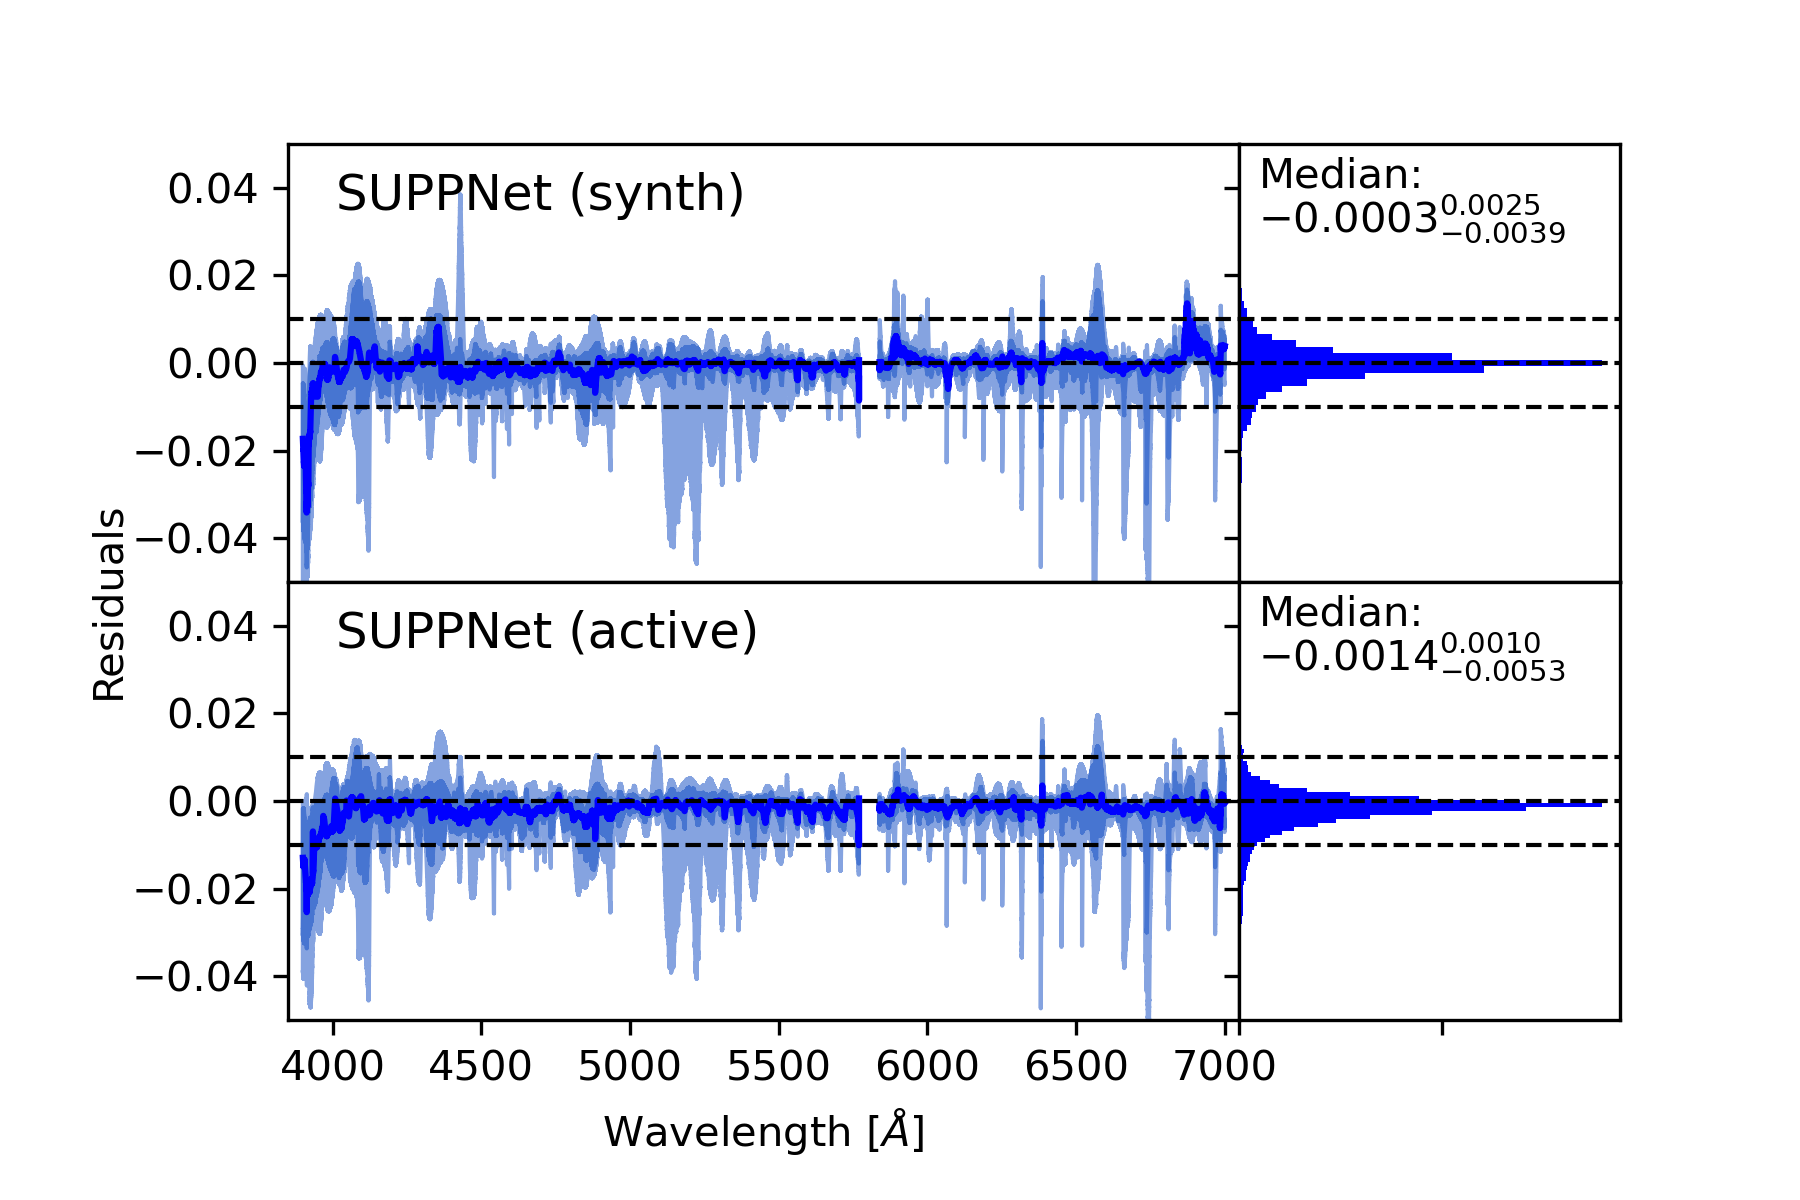
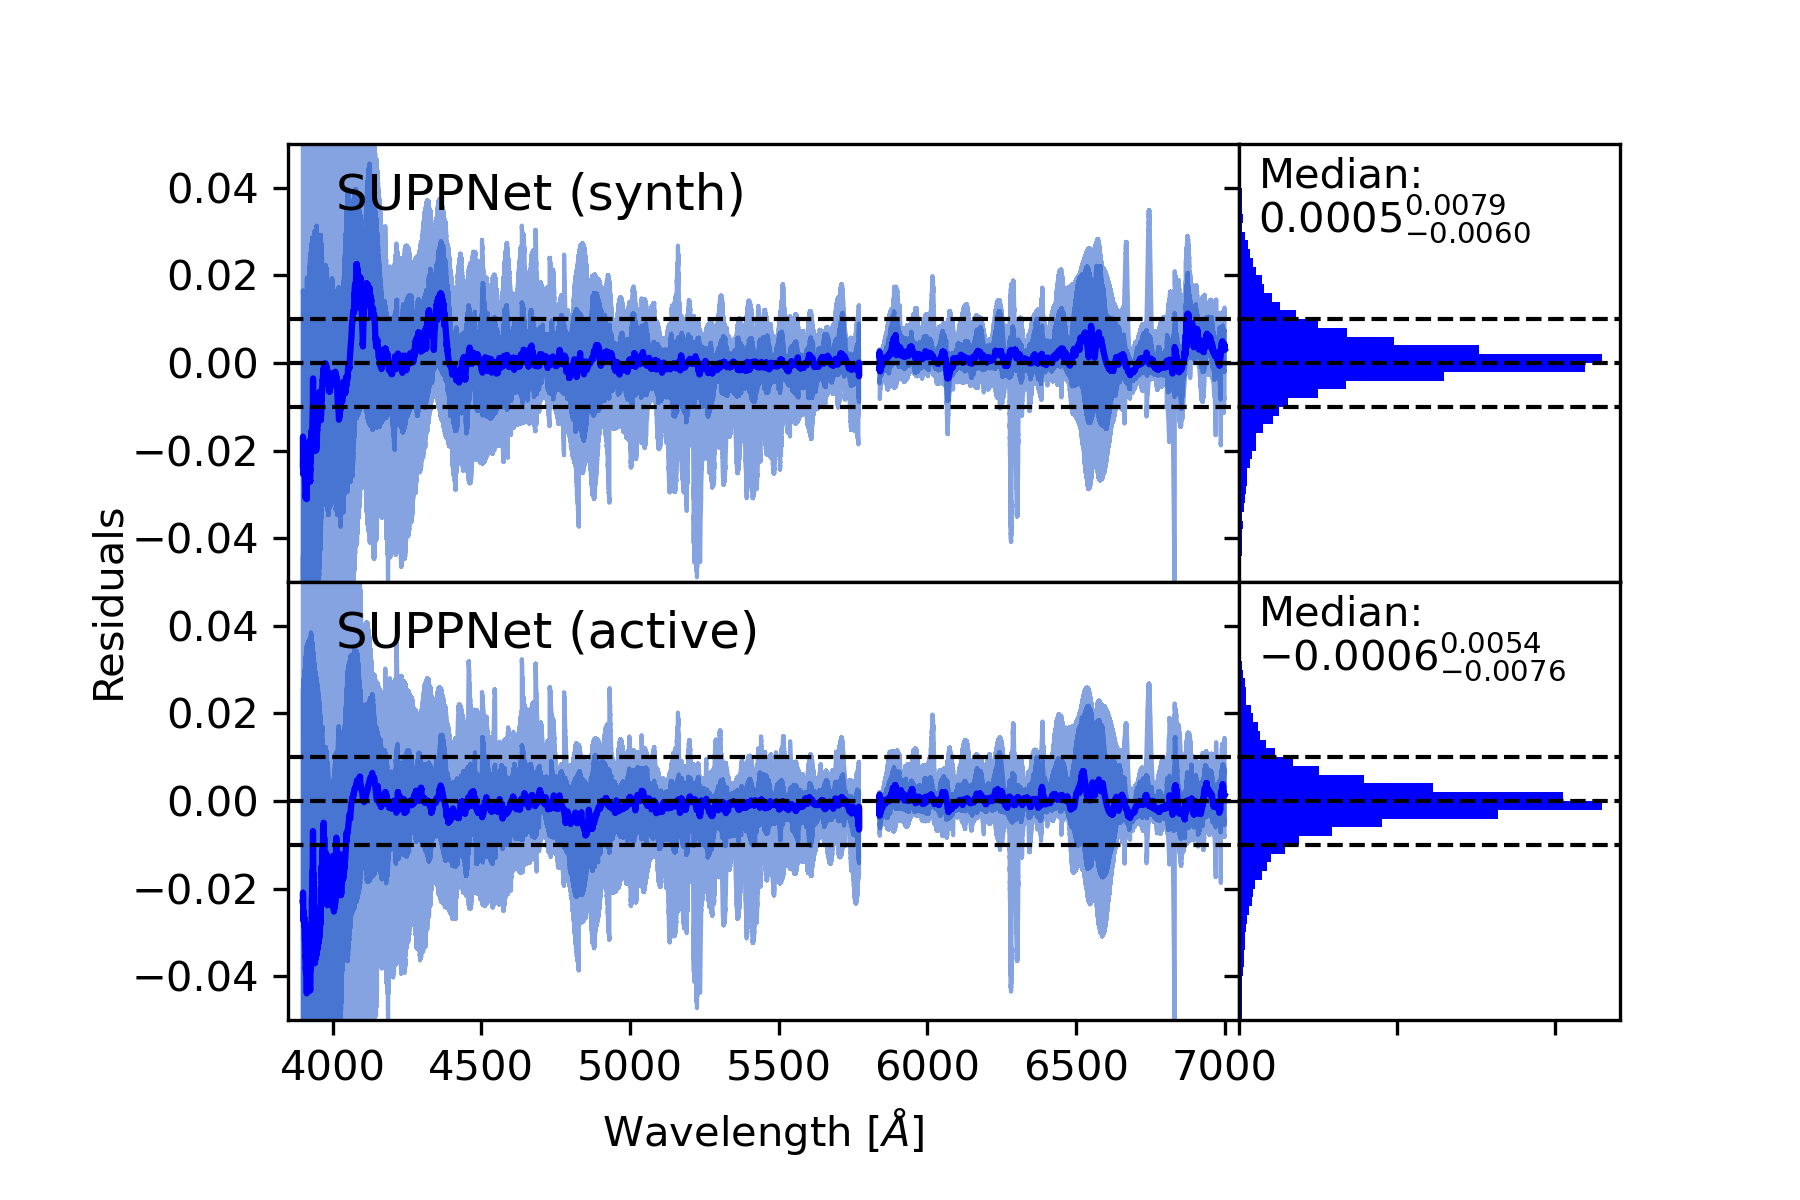
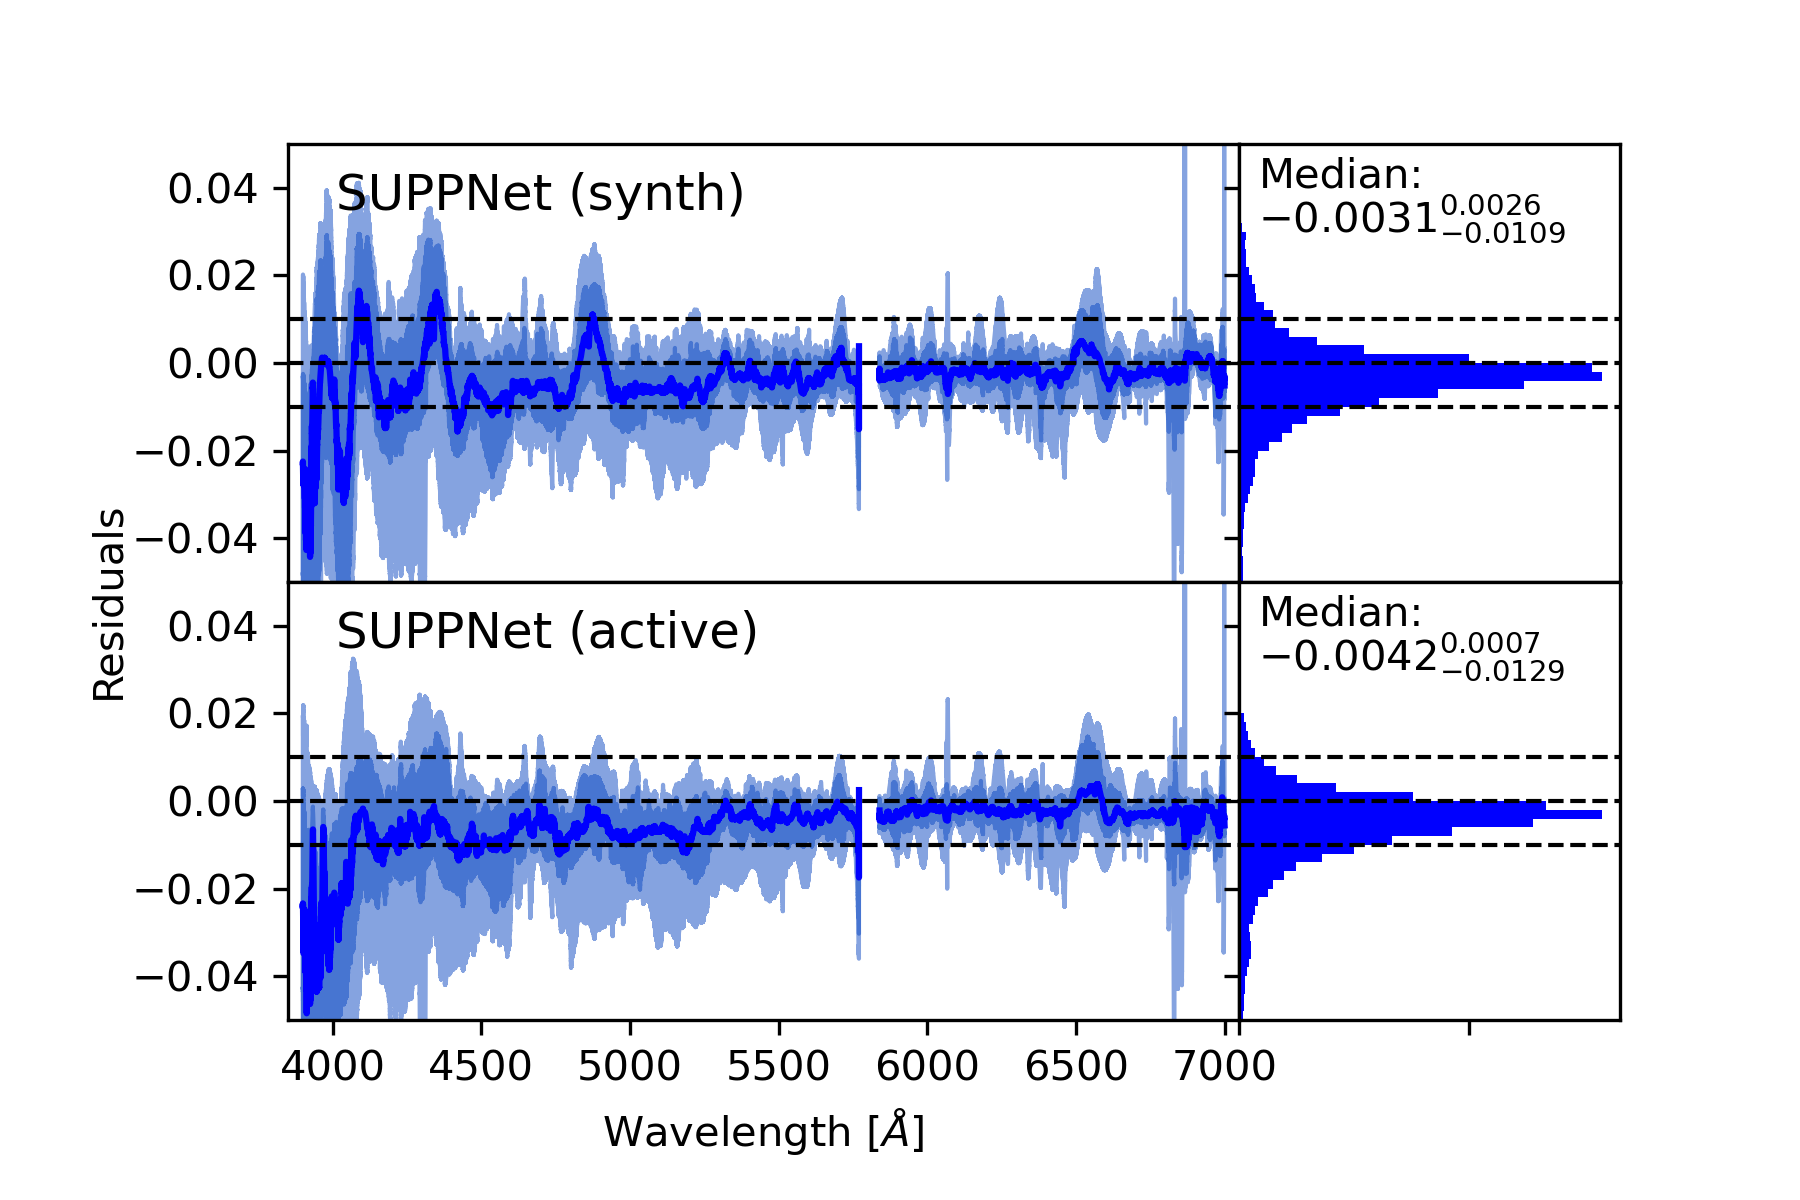
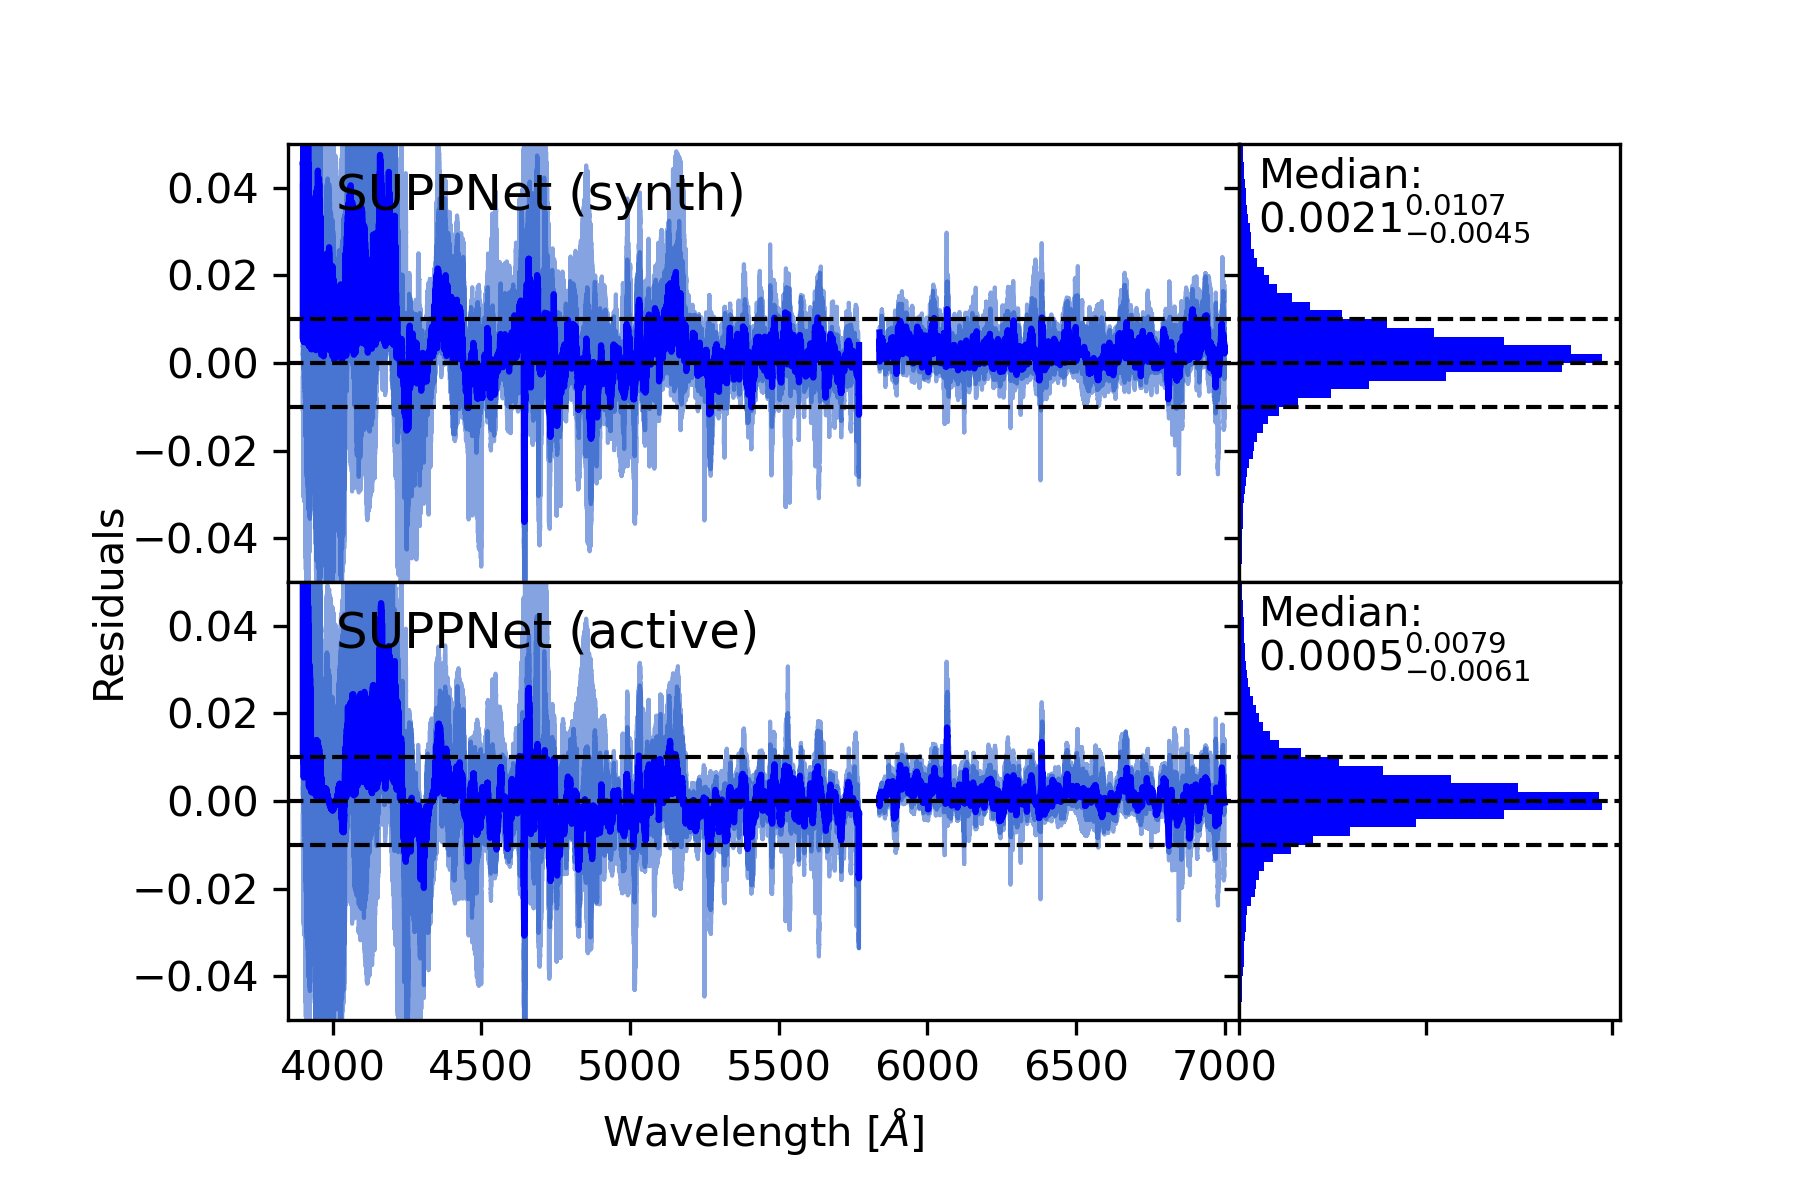
Results of normalisation of six synthetic spectra multiplied by six manually fitted pseudo-continua trained with application of active learning (synthetic data supplemented with manually normalised spectra). In each row, on the left the differences between automatically normalised spectra and synthetic spectra are shown, and on the right, the histograms of those differences with related spectral type, median with 15.87 percentile in upper index, and 84.13 percentile in lower index are displayed. The use of active learning resulted in a slight reduction of residuals dispersion.
Results of normalisation of six synthetic spectra multiplied by six manually fitted pseudo-continua using neural network trained only with synthetic data. In each row, on the left the differences between automatically normalised spectra and synthetic spectrum is shown, and on the right, the histogram of those differences with related spectral type, median with 15.87 percentile in upper index, and 84.13 percentile in lower index are displayed.
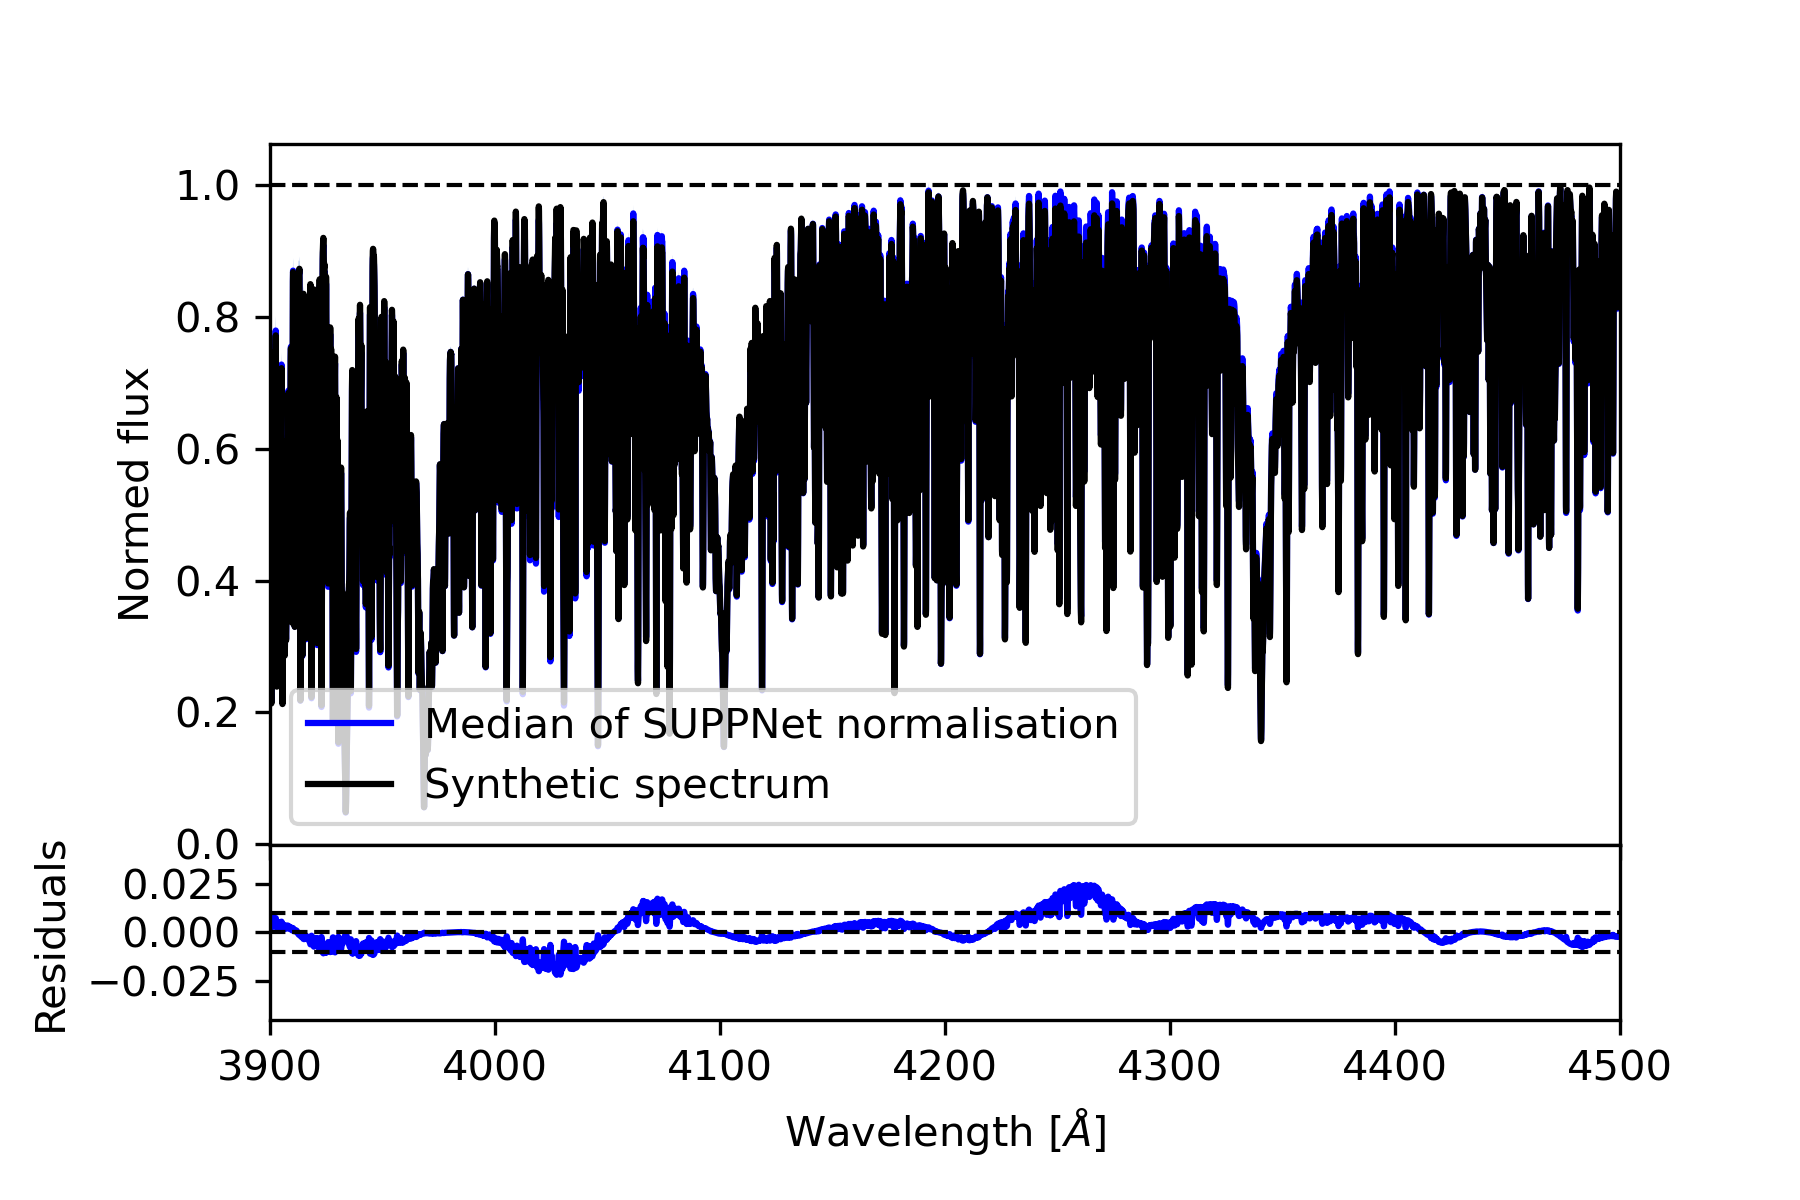
Close-up of 3900-4500 Å spectral range of A3 V synthetic spectrum with median of synthetic automatically normalised spectra (top panel) and residuals of normalisation errors (bottom panel). For this particular part of spectrum the average normalisation is significantly biased. These differences arise due to wide hydrogen absorption lines and strong metals lines which heavily blend in this spectral range.
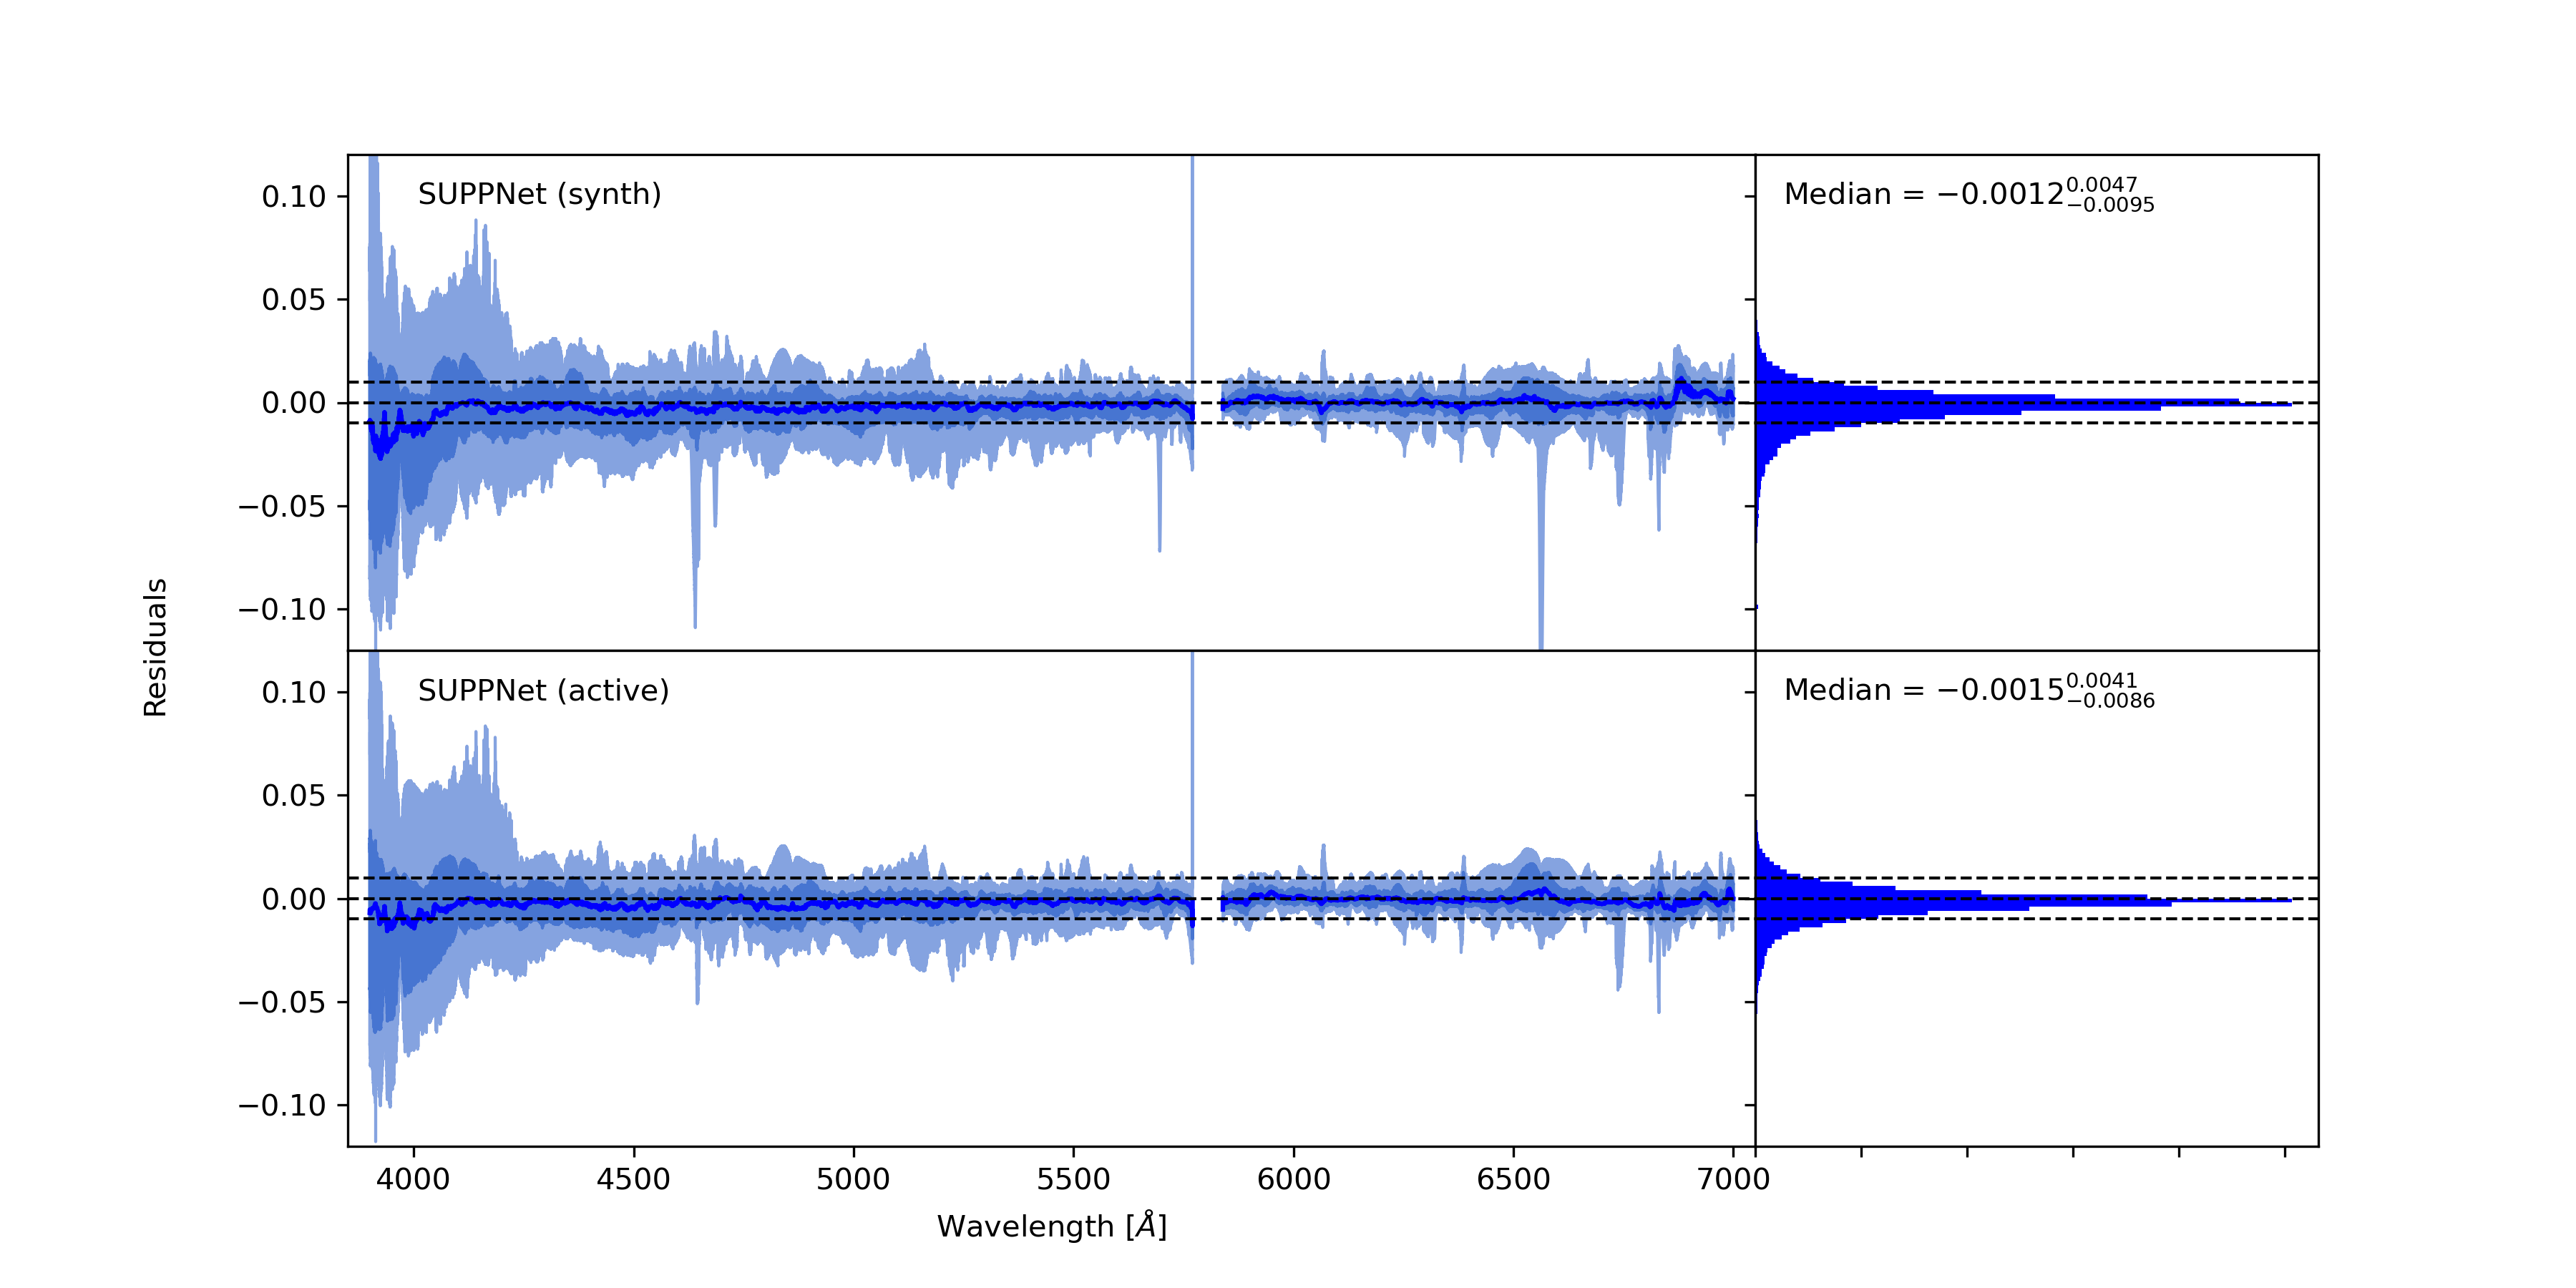
Quality of normalisation measured using residuals between result of SUPPNet method and manually normalised spectra over all stars from UVES POP field stars, that were manually normalised. The line shows the value of median for each wavelength, shaded areas are defined to contain respectively 68 and 95 percent of values (defined by percentiles: 2.28, 15.87, 84.13, and 97.73). Upper panel contains results of algorithm that used only synthetic data for training, lower with active learning. Active learning significantly reduce systematic effects for wavelengths shorter than 4500 Å.
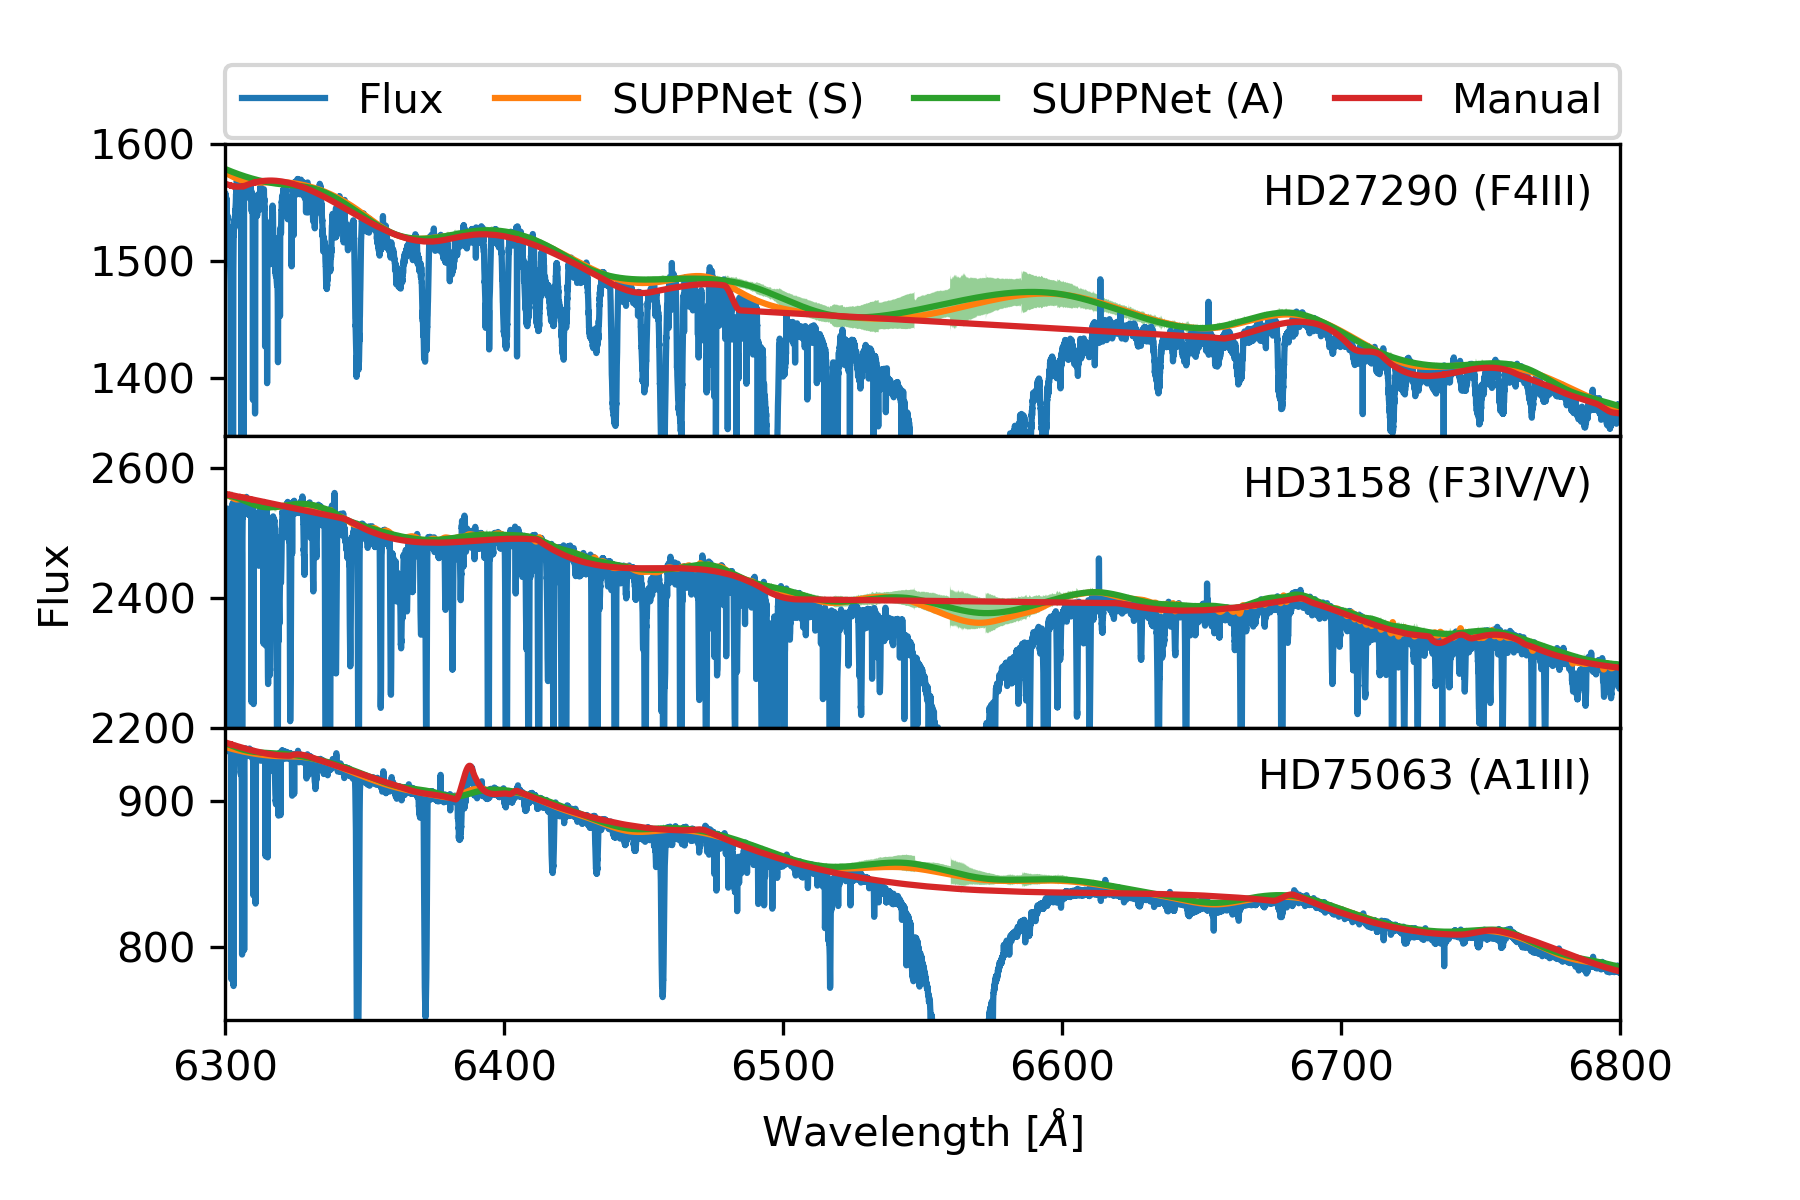
Ha Balmer line region for three UVES POP field stars. Figure shows how wavy pattern prominent in pseudo-continua of F and A type stars are related to manual and SUPPNet predictions. Pseudo-continuum predicted by SUPPNet (A) is shown with an estimate of its uncertainty (method internal uncertainty, green shaded area).
Predicted pseudo-continuum for a spectrum of HD148937 (O6.5) with Ha and HeI6678 A lines in emission. SUPPNet (active) correctly deals with most emission features, while SUPPNet (synth) treats those features as a part of pseudo-continuum. This is an important example where active learning significantly improves normalisation quality.
Residuals between manually normalised spectrum and result of tested algorithm over O type stars from UVES POP field stars, that were manually normalised.
Residuals between manually normalised spectrum and result of tested algorithm over B type stars from UVES POP field stars, that were manually normalised.
Residuals between manually normalised spectrum and result of tested algorithm over A type stars from UVES POP field stars, that were manually normalised.
Residuals between manually normalised spectrum and result of tested algorithm over F type stars from UVES POP field stars, that were manually normalised.
Residuals between manually normalised spectrum and result of tested algorithm over G type stars from UVES POP field stars, that were manually normalised.
Comparison of normalisation quality on the example star of two versions of the proposed method (SUPPNet active and synth) and manual normalisation done independently by three different people (TR, NP, and EN). Upper panel shows original flux with all fitted pseudo-continua. Lower panel shows residuals of normalised fluxes relative to TR normalisation.
Fully Convolutional Network (FCN, Long et al. 2015)
Deconvolution Network (DeconvNet, Noh et al. 2015)
U-Net (Ronneberger et al. 2015)
UNet++ (Zhou et al. 2018)
Feature Pyramid Network (FPN, Lin et al. 2017; Kirillov et al.2019)
Pyramid Scene Parsing Network (PSPNet, Zhao et al. 2017)
U-Net with Pyramid Pooling Module (UPPNet, this work)